Trump vs. Biden: What the Cumulative Numbers Show For Anyone Interested In True Numbers and Not Swayed By Political Interest or Otherwise.

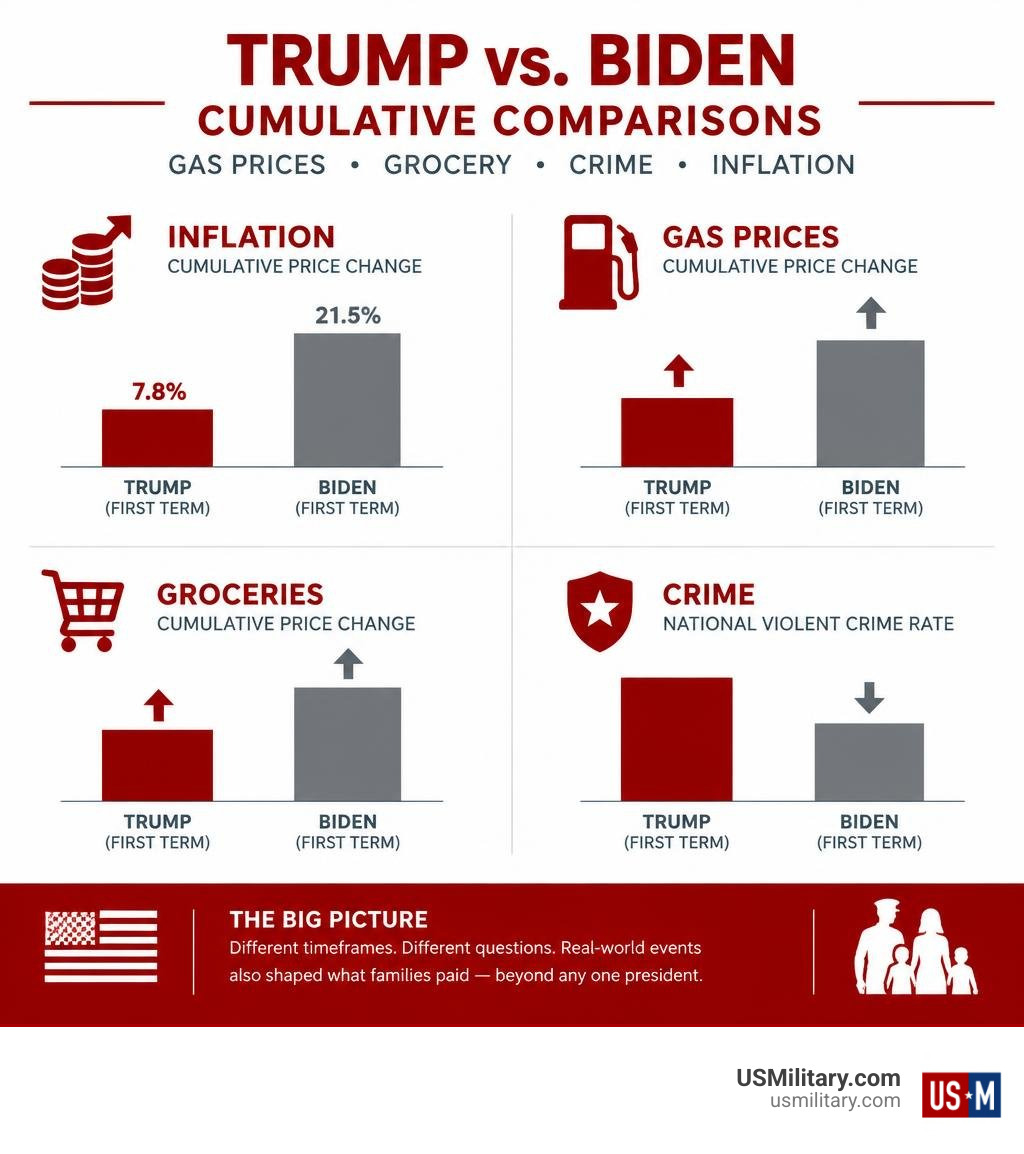
Cumulative comparisons of Trump vs. Biden on gas prices, groceries, crime, and inflation show mixed results. Consumer prices rose 7.8% during Trump’s first term and 21.5% during Biden’s. Grocery and gas prices also rose more sharply under Biden, while the national violent crime rate fell from 2020 to 2024. Trump’s second term is still underway as of October 2026, so we can’t compare it as a full four-year term yet.
The starting date matters. A four-year price change, an 18-month change, and an average price answer different questions. The pandemic and global energy shocks also affected what families paid, apart from any president’s policies.
I’m Larry Fowler, a Navy veteran, BUD/S Class 89 graduate, and publisher of USMilitary.com. My work covering issues that affect military families informs this guide, which compares Trump vs. Biden on gas prices, groceries, crime, and inflation rates.
Basic cumulative comparisons of Trump vs. Biden on gas prices, groceries, crime, and inflation rates vocabulary:
- Why Military Veterans Love President Donald J. Trump
- Is The US Military Becoming More Confident & Stronger With President Trump
- Hate politics and Trump derangement syndrome downgrading America spirit
Cumulative Comparisons: Trump vs Biden in Gas Prices, Grocery, Crime, and Inflation Rates
When we look at kitchen-table economics, numbers tell an undeniable story. However, understanding those figures requires separating political spin from verified government data. A thorough FactCheck.org analysis on presidential economic claims reveals that viral graphics often cherry-pick single months to exaggerate differences.
To provide an accurate picture, we have compiled baseline metrics tracking the Consumer Price Index for All Urban Consumers (CPI-U), retail fuel prices, grocery costs, real wages, and violent crime rates across both administrations.
| Economic & Crime Metric | Trump First Term (2017–2021) | Biden Full Term (2021–2025) | Trump Second Term (Through Oct 2026) |
|---|---|---|---|
| Cumulative CPI Inflation | 7.8% | 21.5% | Accelerating (3.7% YoY Sept 2026) |
| Average Annual Inflation | 1.9% | ~5.0% | ~3.6% |
| Average Gas Price | $2.48 / gallon | $3.50 / gallon | $4.37 / gallon (Oct 2026) |
| Peak Gas Price | $2.98 / gallon | $5.01 / gallon (June 2022) | $4.37 / gallon |
| Grocery Price Increase | 6.5% cumulative | 20.9% to 23.0% cumulative | +4.0% (Nov 2024 – Oct 2026) |
| Real Hourly Earnings | +6.8% | -1.9% | -0.5% (April 2026 dip) |
| Violent Crime Rate (per 100k) | ~379 to 398 | 359.1 (2024, down 33.2 pts) | Mixed local municipal reports |
Understanding these trends helps us evaluate the broader policy debates surrounding military confidence and see how national leadership impacts daily household expenses.
Cumulative Comparisons of Trump vs Biden in Gas Prices and Energy Costs
Fuel prices remain one of the most visible indicators of living costs. During Donald Trump’s first administration, national regular unleaded gasoline averaged $2.48 per gallon according to the Energy Information Administration (EIA). Even excluding the steep drop during pandemic lockdowns, fuel averaged $2.67.
Under Joe Biden, gasoline averaged $3.50 per gallon through mid-2024. In June 2022, national retail gas peaked at an all-time record of $5.01 per gallon. This spike followed post-pandemic supply chain issues, OPEC quota reductions, and Russia’s invasion of Ukraine. To stabilize the market, the administration enacted historic releases from the Strategic Petroleum Reserve (SPR).
Entering Trump’s second term, gas prices held near $2.98 in early 2025 before international disruptions shifted energy markets. Following conflict in Iran, fuel prices rose 47% to reach $4.37 per gallon by October 2026. Diesel saw an even steeper rise, climbing 68% to $6.33 per gallon and increasing transportation costs throughout domestic distribution networks.
Cumulative Comparisons of Trump vs Biden in Grocery, Food, and Supply Chain Costs
The grocery bill represents another major area of household expenditure. According to the Bureau of Labor Statistics (BLS) Food at Home index:
- Trump’s First Term: Grocery costs rose 6.5% cumulatively over four years (3.4% during his first 18 months).
- Biden’s Term: Grocery costs rose 20.9% to 23.0% over four years (16.2% during his first 18 months).
- Trump’s Second Term: Grocery prices increased an additional 4% between November 2024 and late 2026.
Specific pantry staples experienced notable swings. A dozen Grade A eggs, which peaked at $2.08 under Trump’s first term, reached an all-time high of $4.82 in January 2023 under Biden due to avian flu and grain supply pressures. Milk prices peaked at $3.54 per gallon under Trump versus $4.22 under Biden. As detailed in a SmartAsset report on presidential inflation impacts, baseline retail prices have remained elevated across multiple consecutive years.
Cumulative Inflation and Real Wage Growth: Evaluating Purchasing Power
While headline inflation figures illustrate rising prices, purchasing power depends on whether take-home pay keeps pace. Under Trump’s first term, average annual inflation was roughly 1.9%, allowing wage growth to outpace prices and lifting real average hourly earnings by 6.8%.
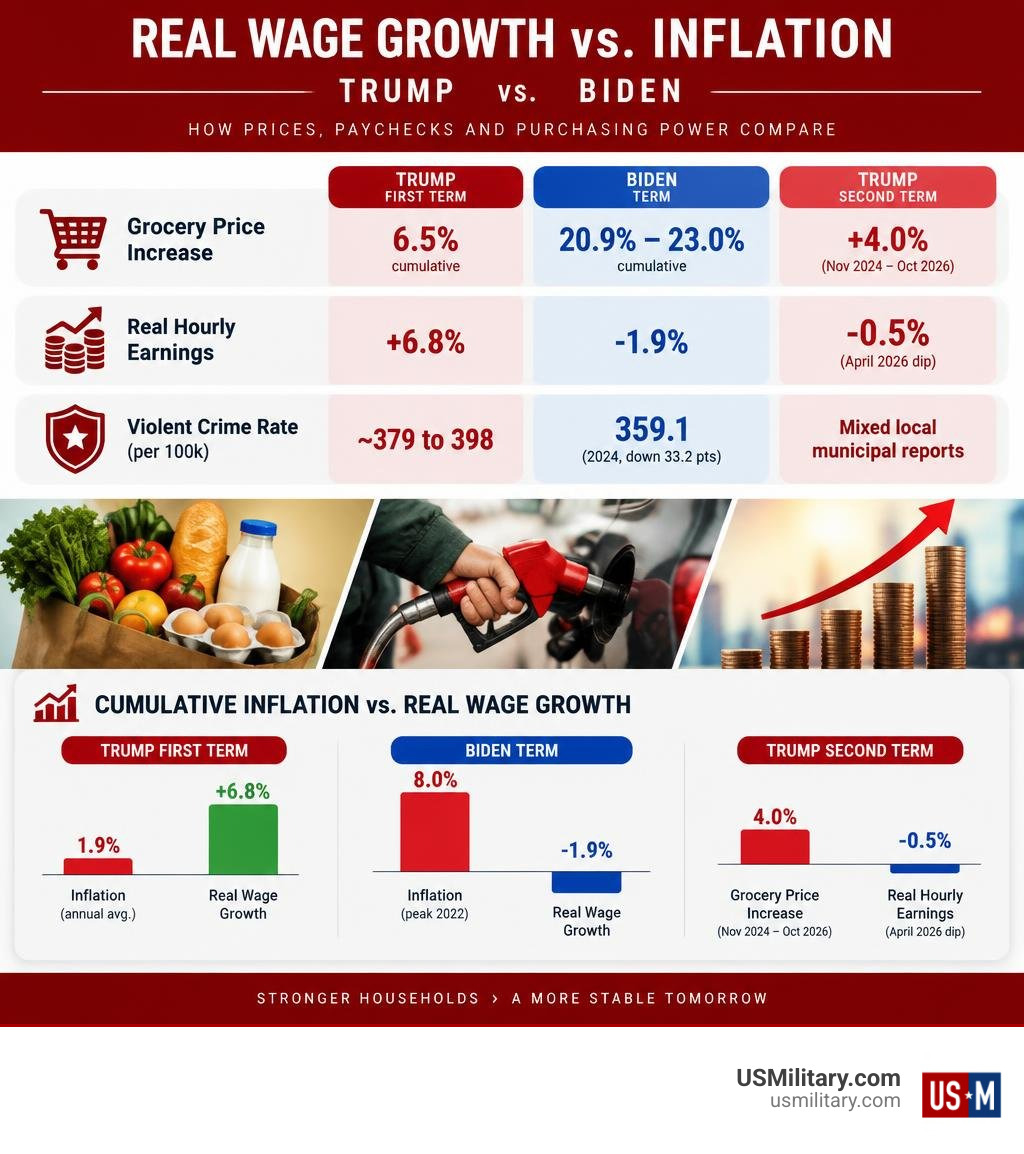
Under Biden, inflation rose to a four-decade peak of 8.0% in 2022. Despite nominal wage gains of 16.7%, consumer price increases eroded purchasing power, causing real average hourly earnings to drop 1.9% overall (with real weekly earnings down 4.0%).
The Federal Reserve responded with aggressive interest rate hikes that pushed 30-year fixed mortgage rates above 7.0%. These changing conditions have shaped veteran sentiment during shifting economic climates as service members balance living expenses and housing choices.
Methodology Matters: 18-Month vs. Full-Term Cumulative Tracking
Viral economic comparisons frequently mix different timeframes, such as matching an 18-month window against a full four-year term. For instance, EXPLOSIVE REPORT: BIDEN vs. TRUMP — 18 MONTHS, 5 CATEGORIES, 5 WINS FOR TRUMP – amg-news.com – American Media Group evaluates the opening year and a half of each presidency, showing Biden-era price increases tracking 2.6 to 4.8 times higher across fuel, food, and electricity.
Regional data also highlights differing local impacts. A State Inflation Data: Families’ Costs Rose $700 More Under Biden Than Over the Same Period Under Trump study from the Joint Economic Committee showed that families in mountain states like Colorado and Idaho absorbed over $1,100 in extra annual expenses compared to earlier baseline trends.
Cumulative Crime Statistics vs. Public Perception Under Trump and Biden
Crime data presents an interesting contrast between reported statistics and public perception. According to the AP-NORC Center, roughly 81% of Americans view crime as a major issue in metropolitan centers. However, federal crime metrics show a downward trend in violent offenses nationwide.
As noted in the FactCheck.org review of Biden final statistics, the national violent crime rate fell by 33.2 points from 2020 to 2024, dropping to 359.1 per 100,000 residents. The homicide rate fell 23% over the same period, declining from 6.7 down to 5.0 per 100,000.
Debates over urban crime and proposals to deploy the National Guard highlight differing views on federal versus municipal policing, an area frequently discussed across media coverage and political discourse.
Violent Crime and Property Crime Trajectories (2017–2026)

Examining the numbers over a decade provides clearer context on property and violent crime:
- 2017–2019: Violent crime rates edged lower during Trump’s initial years.
- 2020: The pandemic brought a sharp 29% rise in homicides, alongside shifts in property offenses.
- 2021–2024: Homicides and aggravated assaults steadily dropped nationwide, though motor vehicle thefts rose 13.4 points in select metropolitan areas.
- 2025–2026: Preliminary city-level reports show continuing declines in homicides across major hubs like Baltimore and San Francisco, alongside ongoing property crime challenges elsewhere.
Frequently Asked Questions About Presidential Economic Comparisons
What were the actual cumulative inflation totals under Trump compared to Biden?
During Trump’s first term (January 2017 to January 2021), cumulative inflation rose 7.8%. Under Biden (January 2021 to January 2025), cumulative inflation increased 21.5%. While campaign rhetoric occasionally suggested price increases exceeded 50%, official BLS data places the cumulative four-year figure at 21.5%.
How did average gas prices compare across both presidential administrations?
National regular gasoline averaged $2.48 per gallon under Trump’s first term and $3.50 per gallon under Biden. Peak pricing reached $2.98 under Trump’s first term, $5.01 in June 2022 under Biden, and $4.37 by October 2026 during Trump’s second term amid regional instability.
Did real wages increase more under Trump or Biden?
Real average hourly earnings grew 6.8% under Trump’s first term as modest inflation allowed wage gains to boost purchasing power. Under Biden, higher inflation led to a 1.9% decline in real average hourly earnings over four years.
Conclusion: Key Takeaways for Military Families and Consumers
Evaluating cumulative economic and crime data requires looking at verified statistics across comparable timeframes. Trump’s first term saw lower cumulative inflation (7.8%) and real wage growth (+6.8%), while Biden’s term saw higher price increases (21.5% inflation) alongside reductions in national violent crime rates. Trump’s second term has brought fresh price pressures, with gasoline reaching $4.37 and year-over-year inflation at 3.7% in late 2026.
For service members, veterans, and military families, managing living expenses means staying proactive with financial planning. Explore our comprehensive veteran and active-duty financial resources hub to learn about VA loan benefits, military retirement strategies, and career transitions across every branch of service. You can also explore specialized Navy career options or find personal growth resources like Dare to Live Greatly to build financial resilience.
Free for Service Members & Veterans
Get the military benefits intel no one tells you about.
Weekly updates on VA benefits, pay changes, and money tips — free for service members and veterans.
No spam. Unsubscribe anytime. Your info is never shared.



Leave a Reply